

Data, the currency helping unlock campus energy efficiency by George Catto, Client Services Director at AMR DNA, an Energy Assets service
There’s probably never been a more pressing need for college and university estates to implement energy efficiency strategies.
Spiralling gas and electricity costs are placing real pressure on operating budgets so, self-evidently, any improvement in efficiency will be much prized. The good news is that energy managers responsible for campus portfolios have more advanced tools at their disposal than ever before, particularly in the analysis and interpretation of consumption data to help root out waste.
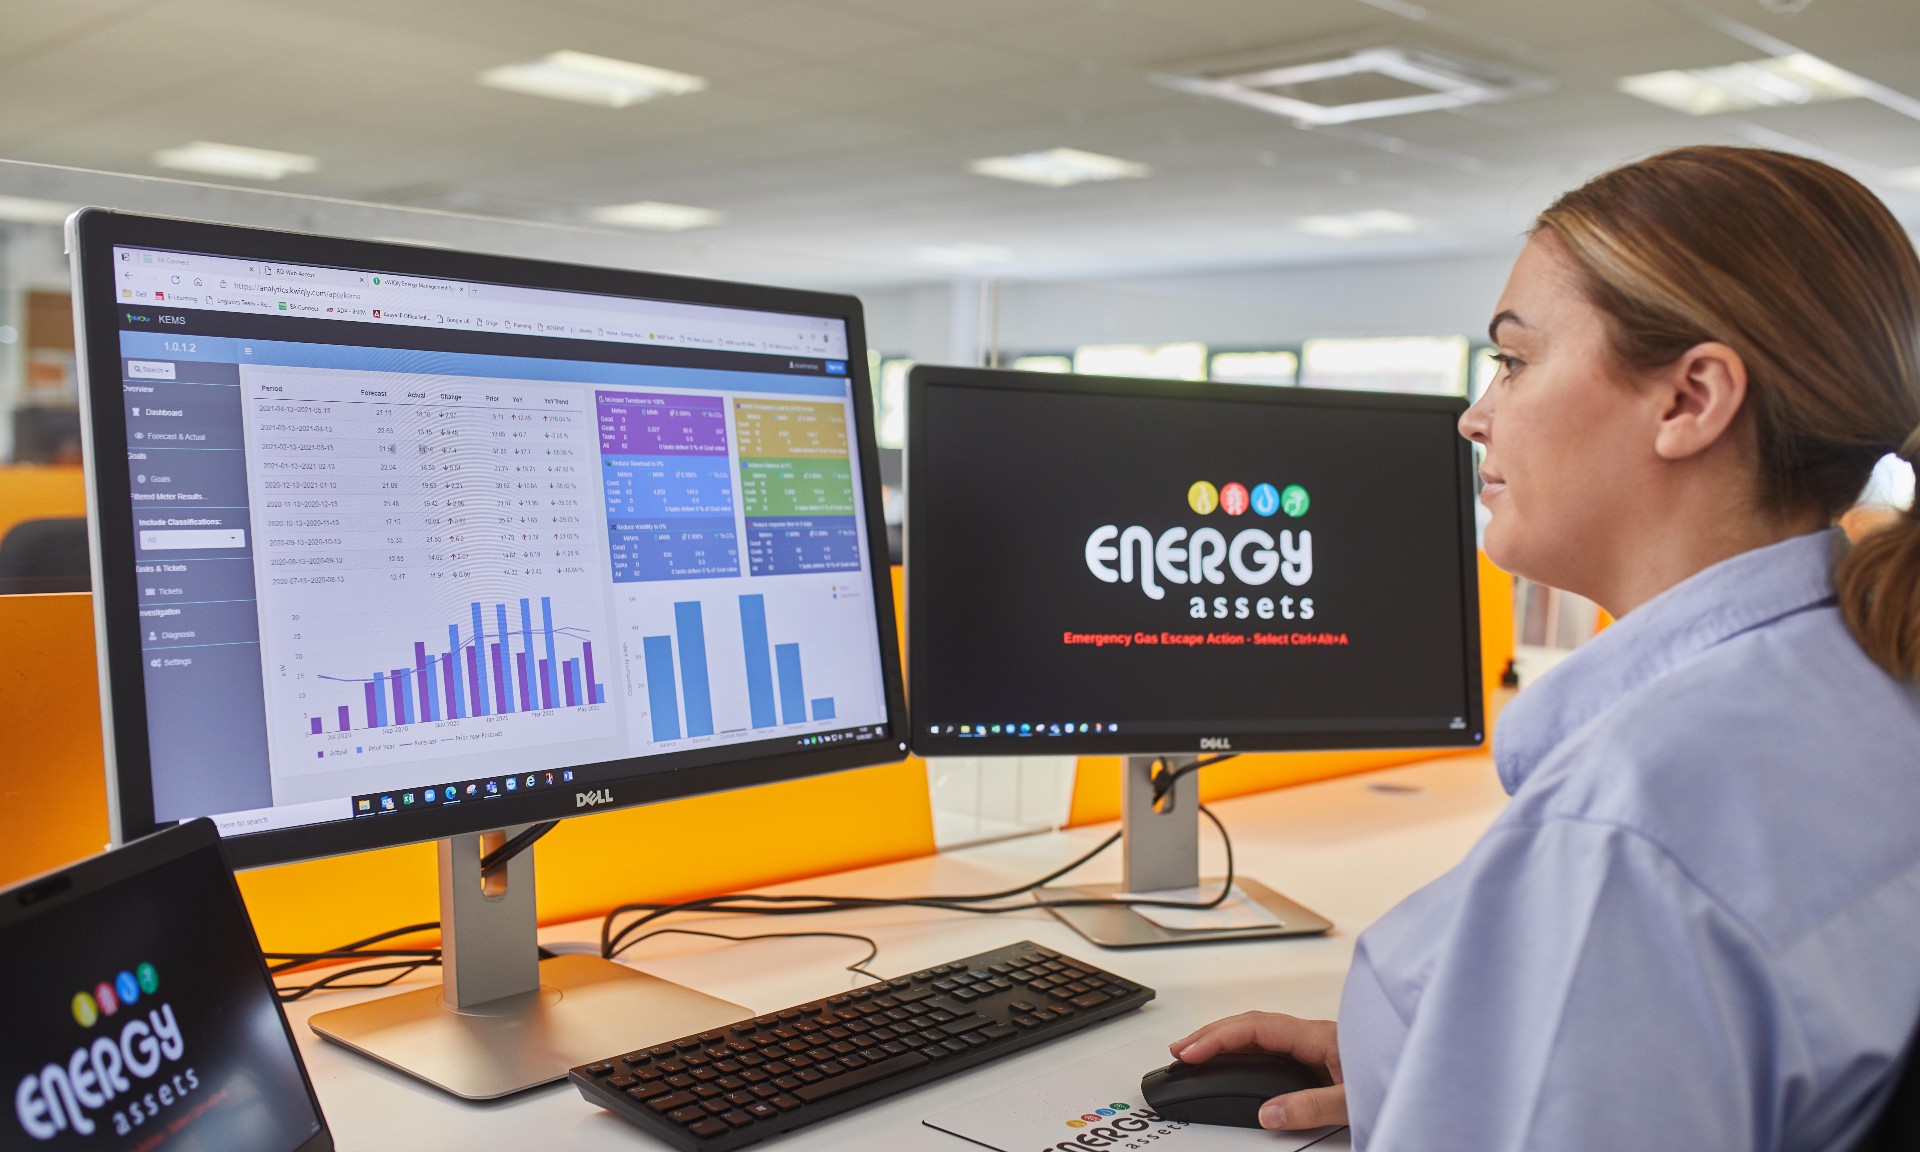
For example, monitoring and reporting platforms that assimilate half hourly data from automated meter reading systems are relatively commonplace. These provide a convenient way of comparing actual consumption versus benchmark parameters, enabling managers to measure the impact of efficiency programmes.
These tools, including WebAnalyser, support a customisable approach to energy reporting, whether that’s monitoring consumption by period, comparing performance to ‘standard’ operating profiles, validating and analysing usage, or automatically alerting users to unusual consumption patterns.
However, extracting ultimate value for this set-up pre-supposes that the underpinning energy performance profiles for each building possess the accuracy to be used as benchmarks.
This is why machine learning, informed by artificial intelligence (AI) is fast emerging as a favoured route to efficiency across the HE and FE sectors. Machine learning systems, such as AMR DNA from Energy Assets, can crunch years’ worth of metered energy data in short order and progressively ‘learn’ what optimal performance looks like for each building.
This creates pattern recognition that can spot tell-tale signs of energy waste unique to each building resulting, for example, from equipment running needlessly or heating controls incorrectly set. As the system continuously monitors consumption data, it identifies potential areas of waste energy through a checklist of priority actions until benchmark performance is achieved. As such, machine learning can be a complementary tool to optimise the value of monitoring and reporting platforms.
Getting the most from any reporting or analytical tool requires all energy related systems to be working in harmony.
For managers, this means:
- Capturing consumption data in granular detail via automated meter reading (AMR) systems
- Monitoring and analysing data through advanced AM&T portals and setting automated alerts for unusual patterns of behaviour
- Applying advanced tools such as machine learning and artificial intelligence to identify waste, set benchmarks, and optimise efficiency opportunities
A machine learning approach has been adopted by The Energy Consortium (TEC), a Contracting Authority, owned by its members, which delivers a wide range of services in energy procurement, data reporting, risk management and cost reduction on a not-for-profit basis for the university sector.
TEC risk manages 11TWh of gas and power across 10,500 meters, and uses AMR DNA energy data service, powered by kWIQly, across a number of HE campuses. This creates data-driven consumption insights that it would take an army of analysts to achieve manually.
The science of energy waste
Pinning down energy waste and improvement opportunities over an estate of complex, multi-faceted buildings, requires rock-solid benchmarks to compare like-with-like. ‘Rubbish in, rubbish out’ is the phrase that comes to mind.
Firstly, though, it’s worth focusing attention on what we mean by ‘waste’ because it comes in many forms:
- Precedent waste - where a building does not perform as well as it has in the past (and noting that operational contexts and use-cases of a building will change and must be re-learned).
- Routine waste - where a building can be shown to systematically use energy that cannot be necessary or comfortable (e.g., if heating is maximised at +5°C, since colder weather requires more heating; a combination of discomfort or waste exists at all temperatures between -5°C and +5°C).
- Peer or benchmarked waste - where a building does not comply with its peers (for example, sets of comparable buildings are expected to have similar balance temperatures, night-setback loads and apparent occupancy patterns).
The analytics engine has several report modes to save energy managers’ time. These include establishing achievable targets by KPI and weather condition for each meter, forecasting future use and identifying where changes have taken place; and diagnosing priority and cause of savings opportunity.
However, it is also important to acknowledge (and quantify) the impact of efforts made. Accordingly, as illustrated below - proof-of-savings reports can include graphic comparisons of prior performance and any change at the click of a button.
Energy Consumption Comparison Report
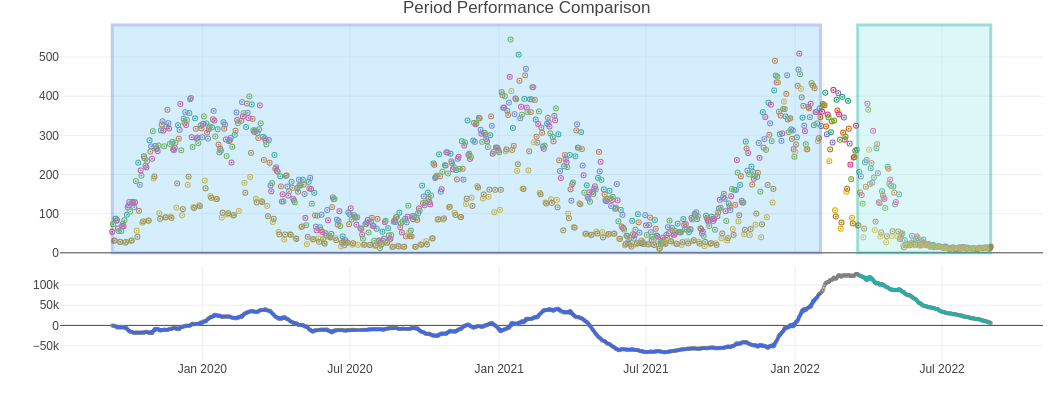
This report compares a period of 874 days from 2019-09-12 to 2022-02-01 with a period of 165 days after the implementation of machine learning changes from 2022-03-19 to 2022-08-30.
Each period has models of consumption in response to outside air temperature for each day of week. These are then applied to a typical annual weather pattern for the location to come up with expectations of annual performance on the new and old basis. The difference represents a saving which might be expected if the performances prior to and after changes were replicated for the hypothetical typical year:
Before kWh = 1251737; After kWh = 852710; Saving Energy 399027 kWh; Saving Percentage 31.9 %; Annualised Value @ 0.04 /kWh = 15961.08
The bottom line represents the cumulative deviation from expected consumption, where ‘Up’ is wasteful and ‘Down’ is ahead of expected. The turquoise section represents the period benefiting from machine learning.
Reliability Observations Report
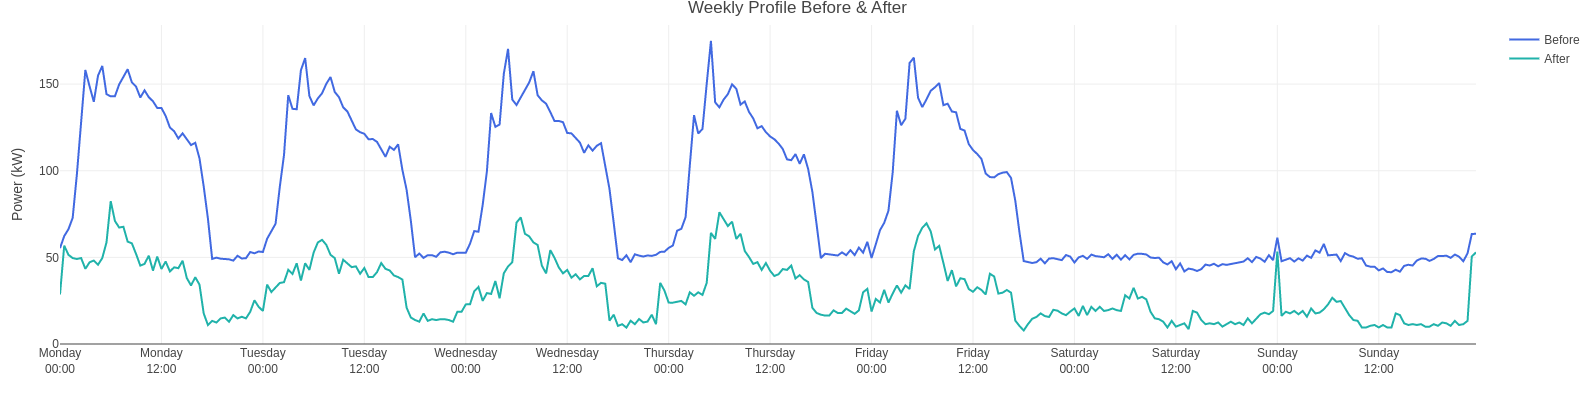
Valid Proof of Savings requires sufficient time period to be considered, during which a representative spread of weather conditions are represented for each day of week. The blue represents ‘before’ machine learning influence, the turquoise line is ‘after’.
Energy managers will use their professional expertise and knowledge of each building to apply machine learning data reports to assess where action can positively impact on efficiency.
Often, it’s a question of spotting improvement opportunities hiding in plain sight, but sometimes these can be the hardest to identify because they are ingrained in a building’s legacy performance and can be easily overlooked.
Fortunately, machine learning, informed by AI, is particularly good at doing the heavy lifting when it comes to data interrogation, consumption pattern recognition and constructing peer-groups of buildings. It can help unpick these categories of waste by thorough historical analysis of half-hourly meter data and interpreting it in the context of how and when the build is operational, taking account of external factors (weather, occupancy levels).
When primed with meter data, weather data and occupancy forecasts, machine learning enables energy managers to fulfil their core role of optimising energy performance across their entire estate by implementing data-led energy waste and carbon reduction strategies. This approach proved particularly valuable during the pandemic, when building occupancy (both in halls of residence and in teaching environments) fluctuated. That said, with escalating energy costs, the ability to scenario plan for efficiency improvements based on rock-solid benchmarking is probably more important today in terms of budgetary planning than at any time in the recent past.
Data Driven Efficiency for TEC Members
In the case of HE and FE sectors, a study of the full TEC portfolio showed that an annual saving potential of £6,000,000 could be achieved if all buildings that do not turn consumption down to 50% overnight were to do so. It may not be practical for every building to do this; however, the beauty of machine learning is that the software allows the addition of any number of markers to support necessary filtering.
Stephen Creighton, Head of Member Services at TEC, says that machine learning has enabled its members to achieve significant improvements in energy efficiency.
He commented: “Every organisation is facing spiralling energy costs, so understanding where efficiencies might be possible is incredibly important. However, the diverse nature of HE and FE estates makes manual analytics unrealistically time consuming. By using tools such as machine learning, managers gain access to granular consumption data, along with checklists of potential improvements. This provides a data-driven foundation for energy and sustainability strategies.”
Moreover, the value of energy-related data will only increase with the Market-wide Half-Hourly settlement (MWHH) reform due by 2025. This environment will enhance opportunities for demand side response incentives and preferential time of use tariffs. The availability of estate-wide rich and relevant consumption data will become increasingly important in helping managers negotiate future energy deals.